Welcome on the DPus site ! - English - Français
|
Home - News - Installer - Binaries (Rar version) - Screenshots - Documentation - Public logo - Links
| ||||||||||||||||||||||
|
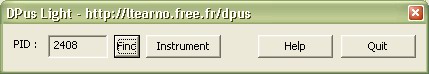
As a first tour, and since the software is at its very first steps, I will give you here an example of use. We are going to spy the well-known MsPaint program and see what buffers it allocates and what GDI objects it creates... First, start MS-Paint program. Then you have to find the PID (process identifier) of the paint application. Then start DPus (after installing it, it should be in Start/Programs/DPus). Click on the 'Find' button and then click on the MsPaint window. The MSPaint.EXE PID should appear in the PID zone.
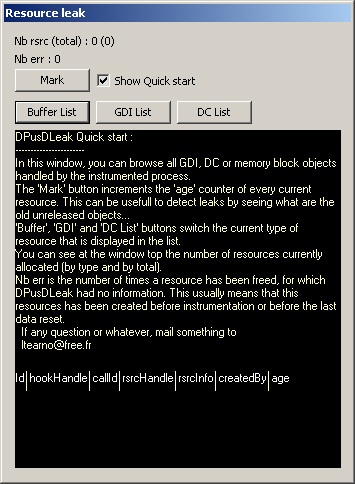
Click the 'Instrument' button. After 2 or 3 seconds, a window is created and attached to the instrumented process. You can now close the first DPus window, by clicking on 'Quit' button. Now we will focus mainly on the dialog window named 'Resource Leak'
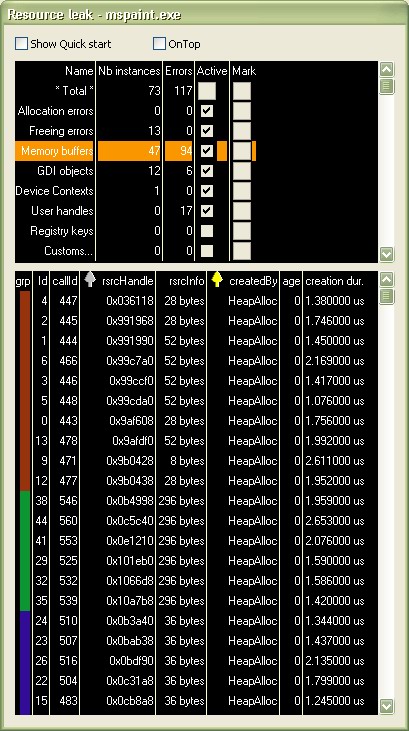
In this window, you can see informations on the resources currently handled by the process. There are no resources displayed now, the liste are empty... Play a little time with MSPAINT application, open menus, draw with several tools, open files, etc... You can now browse each type of resource by clicking 'Buffer List', 'GDI List' and 'DC List' buttons.
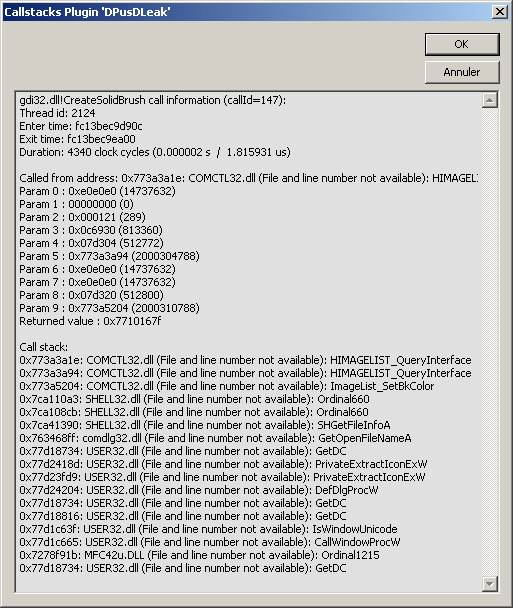
When you click on a line in the list, a window will be popped-up and will show informations about the call that has created the resource.
Here is a little description of what is displayed :
| ||||||||||||||||||||||
|
last update 22/04/2011 |